In a previous post we completed our K8 PI Cluster, we're now going to configure everything necessary to utilize the Kube Dashboard for monitoring and — optionally — managing our deployment graphically.
The following command will deploy the base application to kubenetes with default recommended settings. Recommended settings will cause frequent crashes given our limited spec deployment, I will provide tweaks below to resolve this.
Apply from a YAML file hosted on Kubernetes' Github with the command below if you're not hosting via Raspberry PIs as I am.
kubectl apply -f https://raw.githubusercontent.com/kubernetes/dashboard/v2.7.0/aio/deploy/recommended.yaml
If you are using low-specced servers instead curl down the YAML file for modification using wget -O ~/.kube/recommended.yaml https://raw.githubusercontent.com/kubernetes/dashboard/v2.7.0/aio/deploy/recommended.yaml
This will save it to the .kube directory where I keep all my kube related management files, but can be placed anywhere accessible to the application.
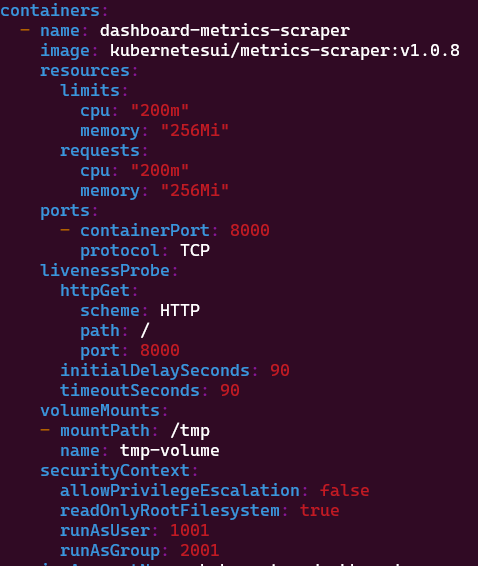
Go ahead and open the file in VIM and search for image: kubernetesui/metrics-scraper:v1.0.8 This will take you to the area of the config related to the container settings for the metrics-scraper portion of the app. Add the following below to increase the base CPU/memory usage and prevent crashes.
 resources:
            limits:
              cpu: "200m"
              memory: "256Mi"
            requests:
              cpu: "200m"
              memory: "256Mi"
Ultimately the section should look like

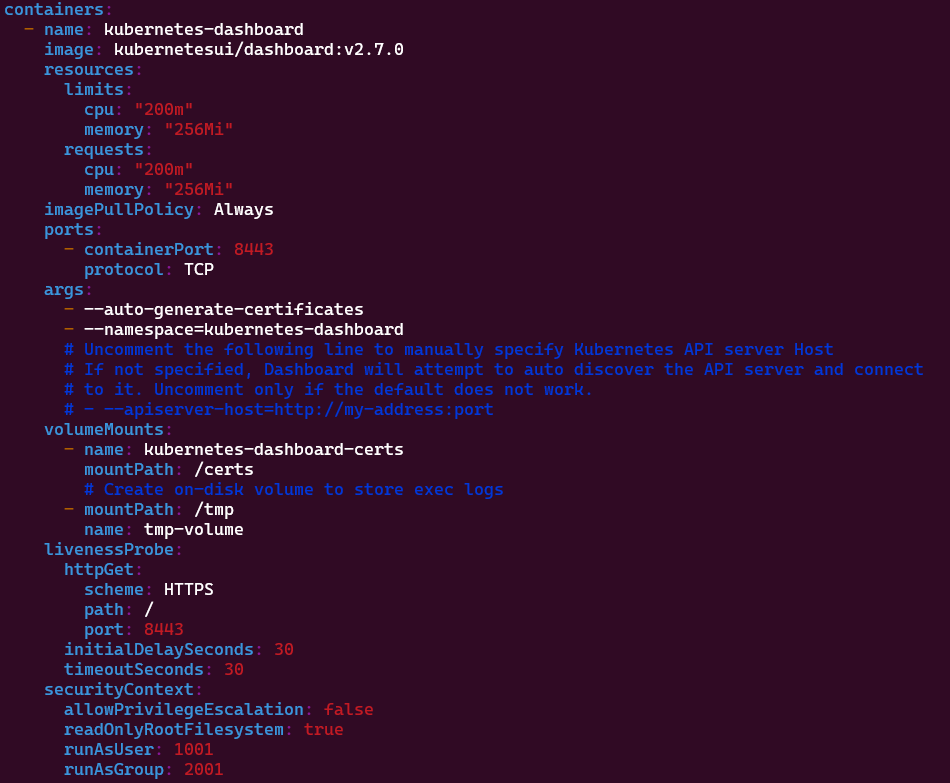
Next do the same for the section regarding kubernetesui/dashboard:v2.7.0. Once again add the following to increase the base CPU/memory usage and prevent crashes.
 resources:
            limits:
              cpu: "200m"
              memory: "256Mi"
            requests:
              cpu: "200m"
              memory: "256Mi"
Results should match:

Next, I wanted to create a serviceaccount for myself to provide appropriate access within the dashboard. You can run the following to create a service account kubectl create serviceaccount mbulla -n kubernetes-dashboard
We've created the account now but I want to see what's happen across all the namespaces on the K8 cluster, I'm also going to write and apply two more YAML files one that defines a role with the access described and another that binds the role to the previously created service account (mbulla).
clusterrole.yaml
apiVersion: rbac.authorization.k8s.io/v1
kind: ClusterRole
metadata:
  name: full-access
rules:
- apiGroups: [""]
  resources: ["*"]
  verbs: ["*"]
clusterrolebinding.yaml
apiVersion: rbac.authorization.k8s.io/v1
kind: ClusterRoleBinding
metadata:
  name: mbulla-full-access
subjects:
- kind: ServiceAccount
  name: mbulla
  namespace: kubernetes-dashboard
roleRef:
  kind: ClusterRole
  name: full-access
  apiGroup: rbac.authorization.k8s.io
Now, to start serving up our Kubernetes server (including the dashboard) over the HTTP we run
kubectl proxy. Note: we'll later convert this into a service to be automanaged.
We can now login to our kube dashboard, except.... we're only serving it up locally but we're running headless Linux, so how can it be accessed? Curl our way through every action? We're back to the CLI at that point.
Instead we're going to create a tunnel from our desired point of connection. In my case, a laptop with a browser installed. To do so, run the following. This will begin servering the content available on port 8001 of 192.168.87.241 (our K8 primary node) on this device's localhost -- port 8001. The -N -L optios prevent you from fully terminaling in, which is a problem when the time comes for us convert it to a service.
ssh -f -N -L 8001:localhost:8001 mbulla@192.168.87.241
Finally we can hit the login screen for our Kubenetes dashboard at the following URL (if you changed ports make sure to adjust for them) http://localhost:8001/api/v1/namespaces/kubernetes-dashboard/services/https:kubernetes-dashboard:/proxy/#/login
Now that we've reached the login screen you may realize we've created an account but we don't have a password or token. We create one from our mbulla serviceeaccount using the following command kubectl create token mbulla -n kubernetes-dashboard of course substitute in your serviceacc name.
Personally, I suggest adding the following alias to make it quick and easy to generate a token on your local machine. alias token='ssh mbulla@kubenode1 "kubectl create token mbulla -n kubernetes-dashboard | xargs"'
You'll be returned a token similar to this:

Select token and paste it inside your kubernetes web dash

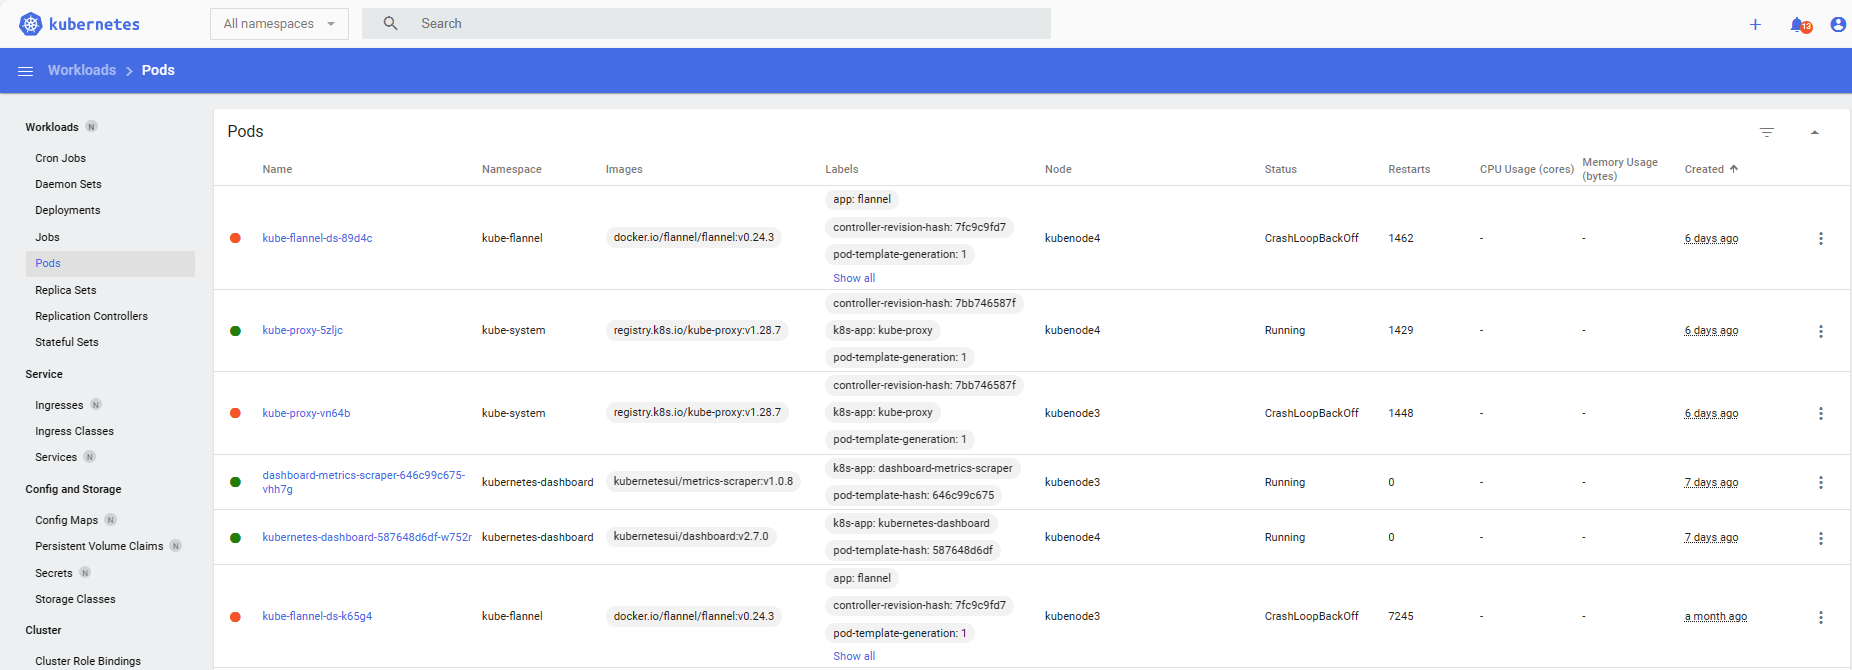
Success! You can now monitor and manage your kubernetes implementation from the web interface shown below.

Tags: Kubernetes SystemD SSH